This article shows how to use Mixed Reality Analytics to capture and review users interaction in your application. All the code is available on GitHub and here’s a short video to give you an idea of what’s possible:
Background
In November I joined a new team at Microsoft focused on Mixed Reality. One of the things our team gets to work on is how cloud and AI can be used to enhance immersive experiences. Even better, if tools or code need to be created our team is empowered to build them. How cool is that!? This post is about the first of several examples we’re excited to share with you over the coming months.
Introducing Mixed Reality Analytics
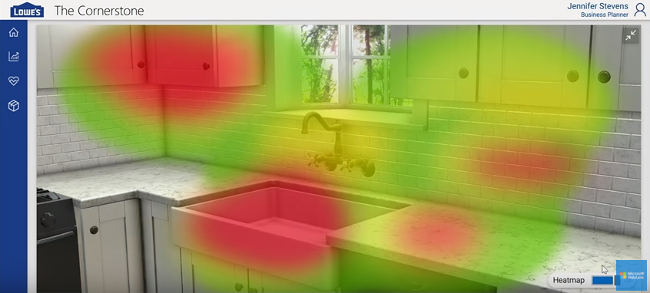
Lowe’s demoed their HoloLens experience for the first time at Ignite 2016. One feature in their demo that got a lot of interest was a heatmap that showed where the user spent most of their time gazing. You can see the heatmap portion of the their demo here:
Since the Lowe’s demo, several customers have asked what it would take to enable something similar in their own applications. This is what one team set out to build during an internal hack in December. Some key features to know about the sample we created:
| Events are queued in a local database | And synchronized to the cloud in the background, as long as internet is available. This allows analytics to be captured in online, offline and sparsely connected environments. |
| Events are stored in SQL on the server | And all data types are normalized to SQL values (e.g. numerical LocalX, LocalY and LocalZ). This allows for additional analytics to be created on the server and even powerful tools like PowerBI to be used. |
| Any GameObject can be included in the heatmap | Not just the HoloLens spatial mesh. This allows us to support all MR apps including VR. |
| Events are captured in local coordinate space | This allows objects to rotate and move over time but still be captured correctly. |
| 3D Visualization | Chosen over traditional heatmap rendering, this approach provides far more control over how events and data get visualized in the scene. |
Getting Started
There is a full demo scene included in the sample with everything setup and ready to test. But before you can run the demo, you’ll need to complete a few tasks:
- Follow all of the steps in the Cloud Setup section to create your own Mobile Service. This is where the data gets stored.
- Follow the steps in the Toolkit section to import the MR toolkit.
After that you’ll be able to press Play in Unity and run the demo scene. To learn more about the demo scene and what you can do with it, check out the Seeing it in Action section at the bottom of this post.
Finally, when you have a feel for what’s possible you can come back and complete the steps under Unity Setup to enable analytics in your own projects.
Where to Download
The source code for this sample currently lives here:
https://github.com/jbienzms/FocusAnalytics
This location may change as we continue to evolve the sample, but if it does I’ll come back and update this post with the new location.
Cloud Setup
The steps in this section assume you’re at least somewhat familiar with Azure Easy Tables. If you’ve never created an Easy Table before I highly recommend you check out this great article on Getting Started with Easy Tables. If you follow the steps in that article, just be sure to use the naming conventions in the list below for the Analytics sample to work. You can also stop reading that article after the Adding a New Table section, since we won’t need the rest of the code they create.
Here are the steps for setting up your Easy Table:
- In the Azure portal create a new Mobile App.
- Once the deployment completes, go the Overview page and copy the Mobile App URI (e.g. http://yourapphere.azurewebsites.net)
- Under the menu for the Mobile Service, create a new Easy Table:
- If you don’t have an existing database click “Connect to a database” and create a database connection.
- IMPORTANT: When creating the database connection your connection string must be named “MS_TableConnectionString” or the connection will not work with Easy Tables.
- After the connection is setup, click the refresh and click on “Create TodoItem”
- Finally, on the Easy Table page click on the plus sign to add a new table and call it “ReportableFocusEvent“. This exact name must be used since the code depends on it, but you do not need to configure any columns (they will get created automatically).
Unity Setup
Toolkit
This sample currently depends on the Mixed Reality Toolkit (MRTK) but we plan to remove that dependency in a future update. Ultimately we would like to support MRTK, VRTK and a “raw” (Unity-only) mode. So the MRTK will still be supported, just not required.
IMPORTANT: A copy of the MRTK is not included in our sample code. This means you’ll need to download the MRTK separately and extract it into the Unity project under Assets\HoloToolkit.
Project Setup
Once the toolkit has been added to your project:
- Add an InputManager from the toolkit anywhere in your scene.
- Disable the two Newtonsoft.Json.dll files under the HoloToolkit folder using the Unity Plugin Inspector. Our project includes newer Newtonsoft.Json.dll files under the FocusAnalytics folder so nothing in the toolkit should break.
Reporter
Your scene will need to include one and only one Analytics Focus Reporter. This behavior is responsible for collecting events, saving them locally and synchronizing them with Azure. Analytics Focus Reporter looks like this:
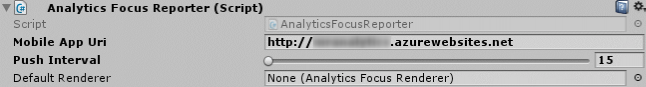
Mobile App Uri is the address of the mobile service you created in step 2 for Cloud Setup.
Push Interval specifies how long (in seconds) you want to capture events locally before attempting to push them up to the server.
Default Renderer allows you to set the renderer (see below) that controls how records are visualized in the scene. If you don’t assign a renderer, a default one will be created for you automatically.
Renderer
Your scene should ideally have at least one Analytics Focus Renderer. As mentioned above, these control how analytic records that were previously captured get rendered in the scene. The current implementation of Analytics Focus Renderer simply instantiates prefabs for each type of record:
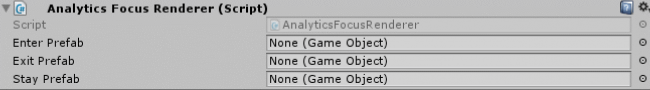
Enter Prefab – the prefab to instantiate for Enter events.
Exit Prefab – the prefab to instantiate for Exit events.
Stay Prefab – the prefab to instantiate for Stay events.
If you do not specify a prefab, Analytics Focus Renderer will use Green , Red and Cyan spheres to represent Enter , Exit and Stay events respectively.
Target
Finally, on each object you would like to capture analytics you’ll need to add both a Collider and an Analytics Focus Target:
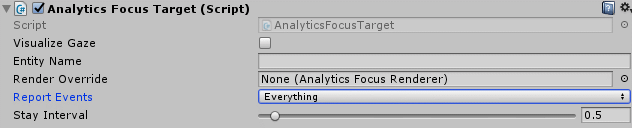
Entity Name allows you to provide an alternate name for the object when it comes to analytics. If a name is not provided, the name of the Unity GameObject will be used.
Render Override allows a different Analytics Focus Renderer to be used for this object. If one is not specified, the Default Renderer (specified on the Reporter) will be used.
Report Events selects which events to capture. Currently the choices are:
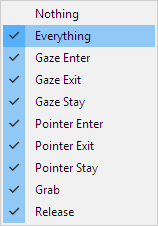
Please note that Grab and Release are not currently implemented. This is because the MRTK doesn’t yet officially support Grab and Release, though experimental support is currently being tested in the Grab Mechanics sample.
It’s also worth pointing out that although we capture Gaze and Pointer events separately, Analytics Focus Renderer doesn’t currently visualize them differently. That’s on our backlog.
Stay Interval allows you to specify how much time should pass between capturing “Stay” events. (“Stay” is Unity speak for “it’s still on the object”.) The default value is once per second, but in the screenshot above the target has been changed to capture every ½ second.
Seeing it in Action
How does it all come together? At runtime the user can simply look around at targets in the scene and events will be automatically captured. You’ll see messages in the Unity console window as events are generated and as data is synchronized with the cloud. But how do we visualize the records that have been captured?
Analytics Focus Reporter has a method called RunReport that can be used to download records and visualize them in the scene. This method takes two parameters: pageSize specifies the number of records to download per page and maxPages specifies the maximum number of pages to download. Think of a page as the number of records to download before rendering them in the scene. The default settings are pageSize = 25 and maxPages = 4, which means Analytics Focus Reporter will download 25 records, render those 25 records in the scene, then repeat up to 3 more times for a total of 100 records.
To make things even easier we’ve integrated playback support directly into the Unity Editor. Whenever Unity is in Play mode you’ll see two new buttons show up in the inspector for Analytics Focus Reporter:
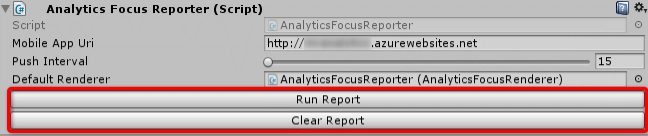
The Run Report button calls the RunReport method above using its default values. Therefore clicking this button will render the last 100 records in the scene.
The Clear Report button removes objects from the scene that have been generated by the reporter.
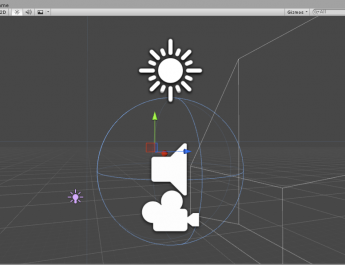
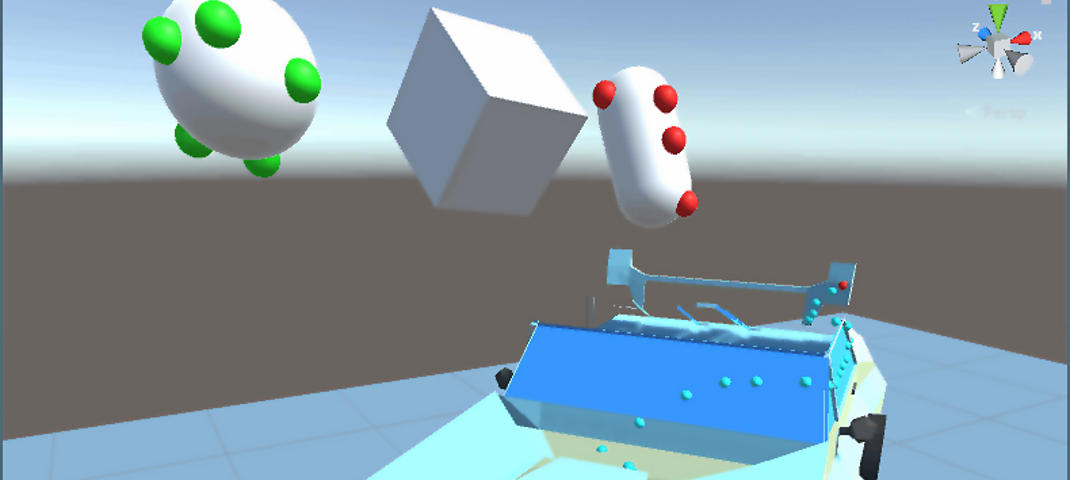
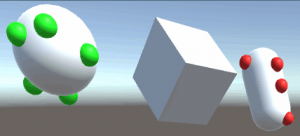
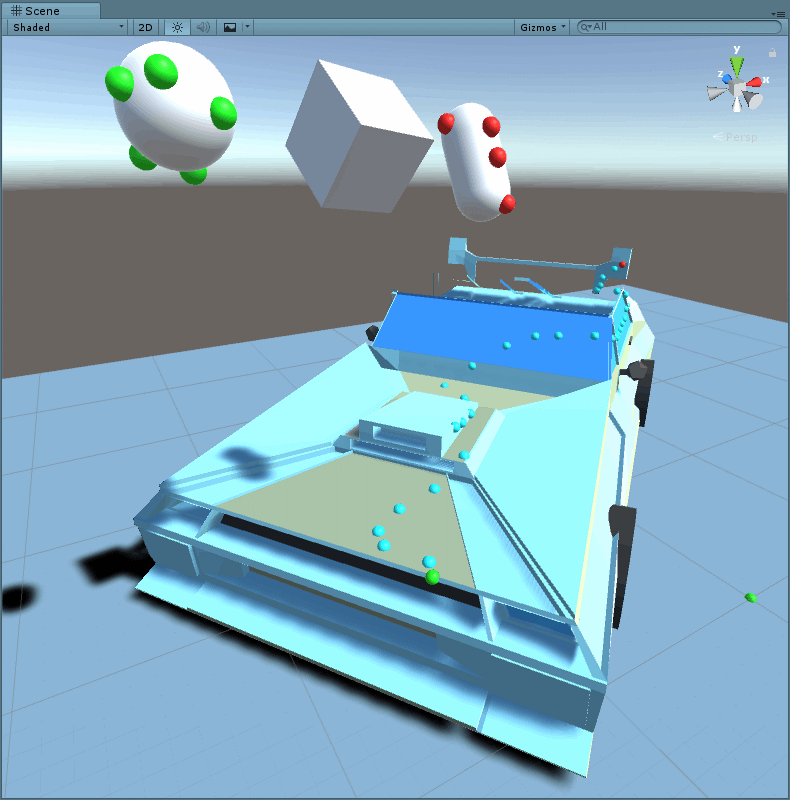
The demo scene that comes with the sample includes four objects to interact with:
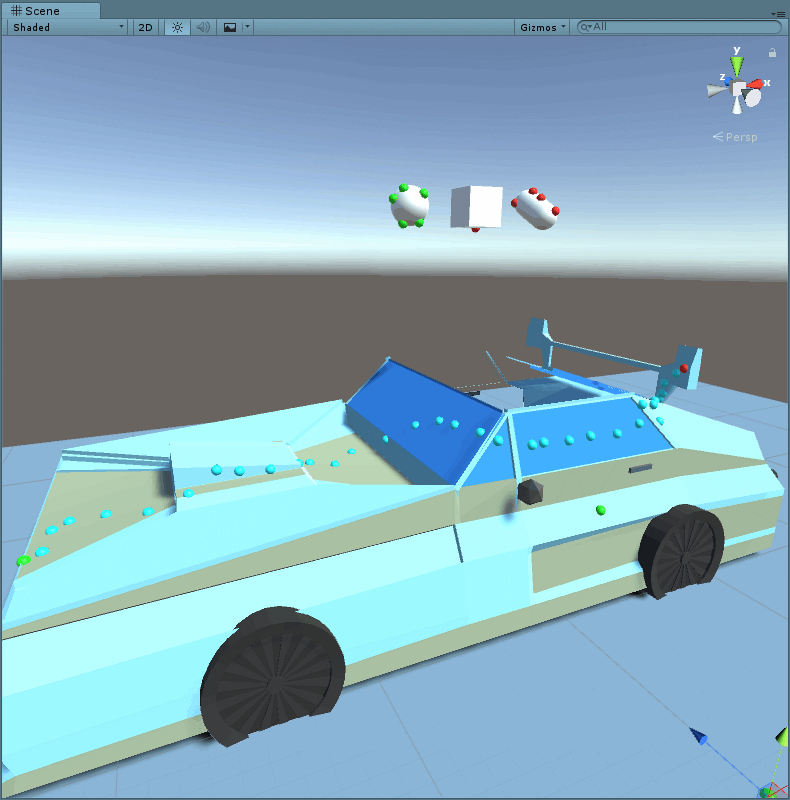
The Sphere at the top-left tracks Gaze-Enter and Pointer-Enter only. The Capsule at the top-right tracks Gaze-Exit and Pointer-Exit only. The Car in the center of the scene tracks all events. In the screenshot above you can see that I started gazing at the hood of the car, slowly moved my gaze down the side of the car, then I stopped gazing at the car near the rear spoiler.
And what’s really cool is that all of these events are captured in the target’s local space, so even if the target moves or rotates events are still visualized correctly.
The Team
Special thanks to everyone that made this sample possible. The original proof of concept was created over a four day hack in December and the original team included Tobiah Zarlez, Doug Holland, Mihaela Curmei and Tommy Patterson. Additional Unity and Azure support was also provided by Adam Tuliper and Brian Peek.
In the weeks following the hack I (Jared Bienz) have contributed and continued to evolve the sample.
Feedback
Capturing feedback is a very important part of what we do. What do you like about this sample? How can it be improved? If you have any feedback please leave it in the comments below or engage us on GitHub. And as always, pull requests and contributions are also welcome.